Another Active Week

What has been an extremely active weather season has continued into this week. How active has it been lately? The only day this month that has not had any severe reports (either tornado, hail, or wind) was April 6. In the past week alone, April 19 had 75 tornado reports (and over 1000 total reports counting hail and wind), and April 22 had 26 additional tornado reports, which included a tornado hitting the St. Louis airport. Coming into today, there had been 776 tornado reports, with an astonishing 574 tornadoes in the month of April, which has already broken the record for most tornadoes in a single month (543 in May 2003). The previous record of tornadoes in the month of April was 267, set in 1974. In other words, this is more than double the previous April record, and we still have an additional six days to add to that total. Since the April 16 outbreak in North Carolina, all the tornado reports seem to be in a line from Ohio to Texas.

Unfortunately, the storms keep impacting the same areas, and that has continued into tonight, as there have been 30 reported tornadoes to this point tonight, from Texas through Tennessee. This storm is associated with an area of low pressure moving slowly across Missouri, with a secondary low situated in Texas. A dry line with the low in Texas helped to trigger the storms in northern Texas, while the storms to the north and east seem to be driven by a slow moving cold front.

While tornadoes, hail, and winds are a definite concern, another factor that this slow moving storm is producing is a lot of rainfall, leading to widespread flash flooding. There has been over six inches of rain south of Tulsa, and extreme SW Missouri has also seen rainfall in the vicinity of six inches. Currently, the heaviest rain is falling in a swath from Illinois to Arkansas, approaching western Tennessee. The front will stall over the next couple of days, causing significant flooding from NW Arkansas through western Tennessee and into southern Kentucky. The rainfall expected will be so severe that the NWS issued a Particularly Dangerous Situation Flash Flood Watch through Wednesday, to go along with the two PDS Tornado Watches currently in effect in the southern plains.

While flooding is a big concern, the tornado threat the next couple days will not diminish. Much like the flooding threat, the tornado threat is maximized in Arkansas, Tennessee, Mississippi, Alabama, and Kentucky. However, there area severe risks in areas all around the country. Both Tuesday and Wednesday have moderate risks associated with them in the areas mentioned above, but there is also a slight risk as far north as New York and Vermont the next two days.

This round of severe weather figures to move offshore sometime during the day on Thursday (depending on how quick the system moves, Thursday may be another day filled with severe weather, models currently disagree on when the system will move offshore). However, just a couple days after this system moves out, another system will move across the Rockies, which will lead to another outbreak starting sometime this weekend, potentially in the same places that have consistently seen severe weather (though this system could extend further north, models once again are not agreeing on the placement and the timing of the system).

Depending on how the two systems evolve, it would not surprise me if the final number of tornadoes reported from the month of April exceeded 700 for the month. This will go down as one of most significant months in recorded weather history.
Posted in Alabama, Arkansas, Flood, Kentucky, Mississippi, Missouri, Oklahoma, Severe Weather, Tennessee, Texas, Tornado | Leave a comment

April 14-16 Tornado Outbreak

In last week’s blog post about the tornadoes in Wisconsin, I ended with the final sentence:

With the potential of tornadoes in the Southern Plains by the end of the week, the number will likely rise again quickly.

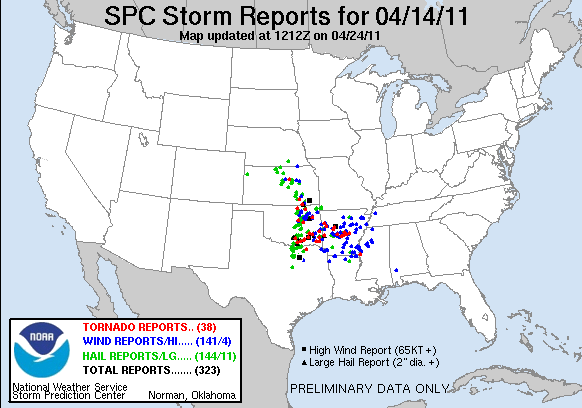
While there were signs that there could be tornadoes in the southern portion of the country as early as Monday, it was hard to envision what transpired between Thursday and Saturday. As of this writing, there had been 267 reports of tornadoes over the three day span, with 29 reported fatalities (4 on Thursday, 4 on Friday, and 21 on Saturday).

The severe weather was associated with an area of low pressure that, on Thursday, moved NE across Oklahoma and into eastern Kansas. By Friday, it had moved across Missouri and into northern Illinois. As the low moved northward, the northern part of the cold front caught up to the warm front, creating an occluded front. A secondary low formed where the occluded front divided into the cold and warm front early on Saturday in West Virginia, moving across northern Virginia before turning north and moving into the northeast, with the storms ahead of the cold front moving offshore.

April 14: Oklahoma, Kansas, and Arkansas

The severe weather on the night of the 14th (including the overnight hours) was mainly concentrated in three states: Oklahoma, Kansas, and Arkansas. 25 of the 27 reported tornadoes were in one of these states, with the others being found in north Texas and western Alabama. In addition to the tornadoes, there were also several reports of softball-sized hail in Oklahoma. The most notable tornado was an EF-3 that led to two deaths in Tushka, OK (SSW of McAlester in the first radar below). The storms pushed into Arkansas late that night and into the early morning hours of the 15th (second radar below), with tornadoes reported as late as 2AM, and winds reaching severe level persisting through the entire night.

April 14 Oklahoma Radar

Overnight April 14-early April 15 Arkansas Radar

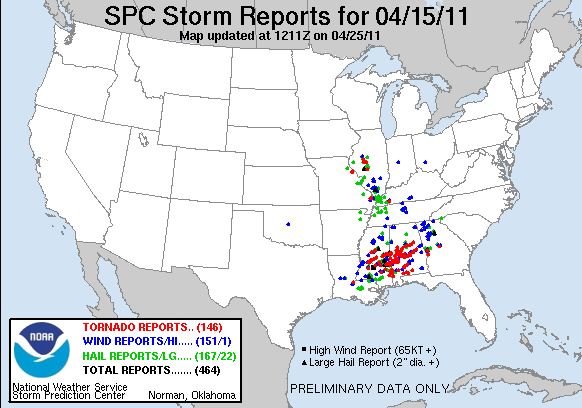
April 15: Mississippi and Alabama

As bad as the 14th was, it appears tame compared to the next two days. The severe weather on the 15th was mostly concentrated in Mississippi and Alabama, although tornadoes were reported in Illinois, Kentucky, Georgia, and Louisiana as well. Among the 120 tornadoes, there was at least one that reached EF-3 classification: a tornado at Clinton, MS (see radar below) that caused 10 injuries. There were two tornadoes that led to fatalities in Alabama (one fatality in Linden, and three near Pratteville), although neither tornado has been rated at this point.

Reflectivity/Doppler Velocity for Clinton, MS Tornado

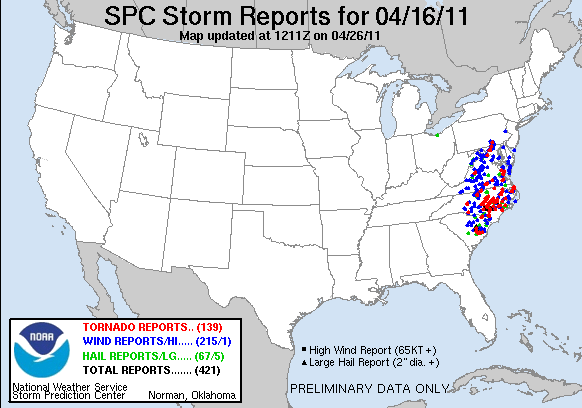
April 16: North Carolina

April 16 SPC Risk Map

The storms on the 16th was concentrated in the state of North Carolina, although there was also significant severe weather in Virginia, South Carolina, and Maryland. I knew early on that this had the potential to be a real eventful day, as the SPC had a ‘high risk’ in eastern North Carolina. This was the first time I had ever seen anything that exceeded ‘moderate risk.’ It wasn’t long before an EF-3 tornado went through the city of Raleigh. This tornado was on the ground for 63 miles. Below is a picture of this tornado, courtesy of WRAL TV in Raleigh:

April 16 Raleigh Tornado

By the end of the day, there would be 120 tornado reports with 21 fatalities due to the tornadoes. In addition to the long lived Raleigh tornado, other significant tornadoes include an EF-3 near Askewville that caused 11 fatalities, and another EF-3 tornado by Fayetteville and Dunn that was on the ground for 65 miles.

In the aftermath of these storms, the number of tornadoes that have been reported in the US have skyrocketed to 589 (as of April 17). Compare that to the 310 we had seen as of April 11, and that shows just how active it was. In fact, the 120 tornadoes reported each on Friday and Saturday exceed the total number of tornadoes (95) that were reported last year up to this point, and now only trails the 622 tornadoes reported in 2008 for most tornadoes at this point of the year.

Posted in Alabama, Arkansas, Kansas, Mississippi, North Carolina, Oklahoma, Severe Weather, Tornado | Leave a comment

Tornado Outbreak in Wisconsin

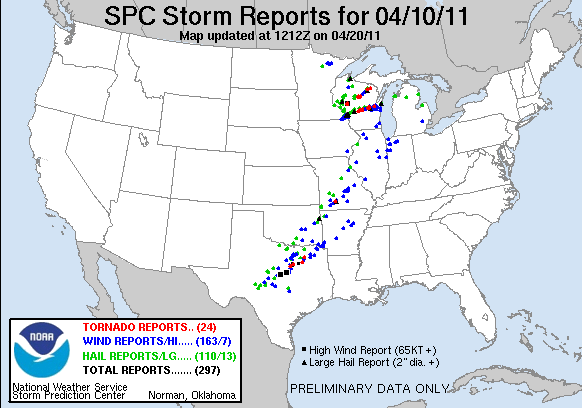
On the evening of April 10, Wisconsin was hit with one of it’s most significant tornado outbreaks in recent history. As of the last report, there had been 11 tornadoes that had touched down in the state, which set the record for most tornadoes in a single day during the month of April. Among the 11 tornadoes, one was rated an EF-3, near the town of Merrill, while there was an additional two EF-2 tornadoes: one near the town of Newald, and the other near the town of Arkdale.

The Setup:

A strong center of low pressure moved NNE across eastern Minnesota and into NW Wisconsin, with a cold front going southward from the center of the low in Minnesota through Iowa, and a warm front moving through Wisconsin and over Lake Superior as the day progressed. As the cold front passed into western Wisconsin, a line of supercells began to form ahead of the front, moving NE across the state (as the radar depicts below). The strongest cell, which included the EF-3 tornado near Merrill that had a path 22 miles long, persisted for close to five hours before dissipating near the Wisconsin-UP Michigan border.

April 10 Wisconsin Radar

In addition to the tornadoes, there were several reports of large hail, including two reports (one in Hokah, MN, and the other in Odanah, WI) of hail three inches in diameter. There were several wind reports as well, particularly around Augusta, WI, where there may have been winds in excess of 90 mph.

The 11 tornadoes themselves originated from two cells. The first cell is the cell that formed SW of Mondovi, WI. This cell produced five tornadoes, including the EF-3 tornado near Merrill, as well as an EF-2 tornado in Forest County. In addition, this storm produced the strong winds mentioned above near Augusta.

The other cell formed in SE Minnesota and crossed into Wisconsin near La Crosse. This storm produced six tornadoes, the most significant being the EF-2 tornado near Arkdale. In addition to the six tornadoes, this storm produced hail as large as three inches in diameter in Hokah, MN, before crossing the border into Wisconsin.

The 11 tornadoes are the 9th most recorded for any day in the state of Wisconsin. It was still well short of of the 27 tornadoes that occurred on August 18, 2005, but it is still incredibly rare to have this many tornadoes at this time of the year. Normally, tornado outbreaks in Wisconsin occur in June, July, or August, with occasional outbreaks in May.

This was just another recent outbreak in what has been a busy past couple of weeks across the country. Despite a slow start, there has been 310 tornadoes as of April 11 this year, putting it well ahead of last year’s pace, in which there had been 92 tornadoes up to that point. The 301 is still slightly below the 346 tornadoes that represent the average amount of tornadoes up to this point of the year. Keep in mind that the 346 number may be skewed a bit from the 618 tornadoes that had been reported in 2008, and that there were only a couple isolated tornadoes in the US until the late stages of February. With the potential of tornadoes in the Southern Plains by the end of the week, the number will likely rise again quickly.

Posted in Severe Weather, Tornado, Wisconsin | Leave a comment

April 4 Severe Weather Outbreak

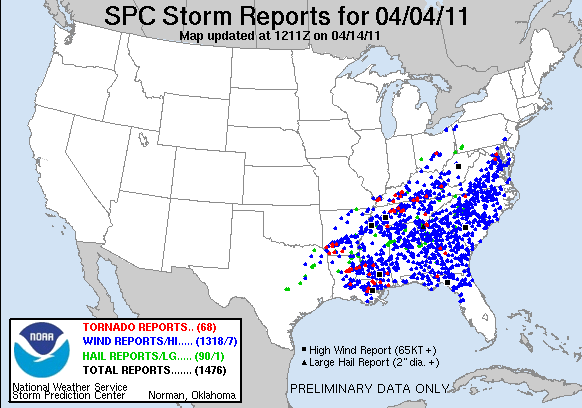
One of the largest severe weather outbreaks in recent times occurred on April 4th through much of the southeastern part of the United States. There were 38 reports of a tornado, in states from Louisiana and Arkansas to Ohio and North Carolina. In addition, there were 89 reports of hail exceeding an inch in diameter, including one report of baseball-sized hail near the town of Resaca in NW Georgia. What may be the most impressive is the high number of severe-level wind gusts. There were 1220 wind reports, including a peak gust of 90 mph 12 miles north of Metairie, LA. There was also a gust of 82 mph in Flatwoods, WV, plus a pair of gusts that reached 80 mph in western Tennessee, one near Cordova and the other near Lexington.

The outbreak was spurred by a strong low pressure system moving across the Upper Midwest. The morning of the 4th, the low pressure center was located in Michigan. Behind the low, a cold front stretched from Michigan to Texas, with a warm front ahead of the low going from the low to near Delaware. Dew points in the south were approaching 70 degrees, particularly in Louisiana, Arkansas, and Alabama. For a city like New Orleans, this is about 10 degrees higher than normal (average April dew point for New Orleans is 59 degrees). A southerly wind from the Gulf of Mexico added additional fuel to the fire.

As the day progressed, a squall line formed, first dropping hail in Texas, then strengthening once it crossed into Arkansas, stretching up into Kentucky. At around 14 Z, the first two tornadoes were reported in Arkansas. One has already been determined to be an EF-1 near Whelan Springs. A little over an hour later, an EF-2 tornado was reported just south of Kevil, KY. This tornado traveled seven miles and had a average path width of 250 yards. From 1518-1741 Z, there were eight reports of tornadoes in western Kentucky alone (note that there is at least one tornado, the EF-2 near Kevil, with multiple reports, so the number of actual tornadoes is likely less than reported).

After Kentucky, the next state to get hit by a series of tornadoes was Tennessee. Roughly 40 minutes after the last tornado in Kentucky, there were eight tornado reports in Tennessee (plus an additional report in Mississippi) over the span of hour. One of the tornadoes, and EF-1 near Smyrna, TN, appeared to have multiple reports, but otherwise they appeared to be separate tornado reports.

The next state to get hit was Louisiana. There were nine tornado reports in Louisiana, beginning at 1937 Z, with the final tornado reports in the states roughly four hours later. The strongest tornado in Louisiana at this time appears to be an EF-2 tornado located four miles north of St. Joseph at 21 Z. As the night went on, additional tornadoes appeared in Mississippi, as well as one weak tornado in Ohio.

The overnight hours spawned a couple tornadoes as well in Georgia and North Carolina. The tornado in Georgia, an EF-2 tornado near Bailey’s Park, caused one fatality and had two additional injuries. While the system caused additional severe weather throughout the day today in eastern Virginia, eastern North Carolina, and Florida, there were no reports of tornadoes, and only one report of hail an inch in diameter. Wind reports were also down from yesterday, with only 50 wind reports, and a peak recorded gust of 67 mph in Deltaville, Va.

Posted in Arkansas, Georgia, Kentucky, Louisiana, Severe Weather, Tennessee, Tornado | Leave a comment

Tornado Trends

According to the Storm Prediction Center, there were 1280 tornadoes in the continental United States during the year 2010. There was at least one tornado in 44 of the 48 states (excluding Alaska/Hawaii: Delaware, Massachusetts, Nevada, and Rhode Island did not have any), while three states exceeded 100: Minnesota (113), Texas (107), and Oklahoma (102). The 1280 tornadoes break down into the following categories:

EF0: 770
EF1: 339
EF2: 127
EF3: 31
EF4: 13
EF5: 0
Total: 1280

Going back to 1950, 2010 places 7th out of 60 for tornadoes in a single year, coming well short of 2004, which had 1817 tornadoes (1216 of which were F0 tornadoes). But how does this compare to other years, and are there any definitive trends that have developed over time? Let’s compare years by taking the data from every five years from the start of the period to today.

1950
F0: 19
F1: 83
F2: 68
F3: 24
F4: 7
F5: 0
Total: 201
Rank: 60/60

1955
F0: 191
F1: 200
F2: 163
F3: 29
F4: 8
F5: 2
Total: 593
Rank: 51/60

1960
F0: 165
F1: 230
F2: 173
F3: 41
F4: 6
F5: 1
Total: 616
Rank: 48/60

1965
F0: 293
F1: 258
F2: 248
F3: 67
F4: 30
F5: 1
Total: 897
Rank: 28/60

1970
F0: 192
F1: 227
F2: 190
F3: 35
F4: 8
F5: 1
Total: 653
Rank: 47/60

1975
F0: 310
F1: 373
F2: 191
F3: 34
F4: 11
F5: 0
Total: 919
Rank: 26/60

1980
F0: 269
F1: 398
F2: 162
F3: 32
F4: 5
F5: 0
Total: 866
Rank: 30/60

1985
F0: 308
F1: 259
F2: 79
F3: 29
F4: 8
F5: 1
Total: 919
Rank: 43/60

1990
F0: 537
F1: 385
F2: 155
F3: 41
F4: 12
F5: 3
Total: 1133
Rank: 14/60

1995
F0: 822
F1: 284
F2: 98
F3: 20
F4: 11
F5: 0
Total: 1235
Rank: 9/60

2000
F0: 723
F1: 269
F2: 62
F3: 20
F4: 3
F5: 0
Total: 1133
Rank: 14/60

2005
F0: 815
F1: 344
F2: 85
F3: 20
F4: 1
F5: 0
Total: 1265
Rank: 8/60

2010
EF0: 770
EF1: 339
EF2: 127
EF3: 31
EF4: 13
EF5: 0
Total: 1280
Rank: 7/60

The number of tornadoes in a given year has risen significantly over the past couple of decades. In fact, from 1990-2010, the only year that does not rank among the top 20 years in terms of most tornadoes is 2002, which places 23rd over the 60 year period. This, however, doesn’t necessarily suggest that there has been a large increase in tornadoes. There are a couple reasons that help explain the rise in total number of tornadoes. First of all, Doppler radar has made it much easier to identify when and where a particular storm may be producing a tornado. This leads to the biggest reason for the increase in total tornadoes: the number of (E)F0 and- to a lesser extent- (E)F1 tornadoes that have been documented. The majority of these tornadoes are relatively weak and would not produce much damage, so if they occurred in regions that was sparsely populated, they often were missed. The number of F0 tornadoes in the 1950’s and every other decade likely were around the same number as there have been the past decade, they just weren’t documented.

What hasn’t increased is the number of significant tornadoes- (E)F3 or higher. In fact, it seems to be trending downward over time. This list shows the number of (E)F3 tornadoes or higher per decade, as well as last year:

1950’s: 484 = 48.4 per year
1960’s: 549 = 54.9 per year
1970’s: 596 = 59.6 per year
1980’s: 375 = 37.5 per year
1990’s: 430 = 43 per year
2000’s: 311 = 31.1 per year
2010: 44

This trend isn’t might not be quite as conclusive as the number of tornadoes, but there still appears to be a downward trend. The numbers for the 1970’s may be skewed by the Super Outbreak in April 3-4 of 1974 (in which there were 64 F3 or higher tornadoes alone, the largest tornado outbreak on record- it included an astounding six F5’s). Besides that, one reason may be that the classification of tornadoes is more accurate now than what it was in the past. For example, what was classified as an F3 tornado then may have actually been considered an EF2 if the same tornado were to occur today.

Posted in Severe Weather, Tornado | Leave a comment

Spring Flooding: Revised Predictions

Back in early February, I wrote about the potential for spring flooding in portions of the Upper Midwest, particularly the Red River of the North and the Mississippi River. With the heavy amount of rain and snow in the region during fall/winter, the chances for significant flooding were high. With temperatures in much of the Upper Midwest exceeding 40 and reaching into the 50’s the past week (note: a cold front moved through today, causing temperatures to drop to near or below freezing in North Dakota and Minnesota), spring flooding is likely to be at its peak within the next couple of weeks. In some places, such as the James River in South Dakota, they have already exceeded major flood stage. As we approach the peak of flooding season, let’s take another look at the flood potential in the region.

So how do the flood probabilities now compare to how they were in early February? Let’s compare the same two sites we looked at back then: the Red River at Fargo, ND, and the Mississippi River at Hastings, MN. First, the early February flood probabilities at Fargo:
-Chances of Moderate flooding: >99%
-Chances of Major flooding: 95-98%
-Chances of Historical Crest (40.84 ft): 15-20%
-Chances of top Five Historical Crest (37.13 ft): 40-45%
-Chances of top Ten Historical Crest (34.65 ft): 80-85%
-Rough estimate of river crest with EP of 75%: 35 ft (rank: 9)
-Rough estimate of river crest with EP of 50%: 37 ft (rank: 6)
-Rough estimate of river crest with EP of 25%: 40 ft (rank: 2)

Here are the current probabilities at Fargo:
-Chances of Moderate flooding: >99%
-Chances of Major flooding: >99%
-Chances of Historical Crest (40.84 ft): 30-35%
-Chances of top Five Historical Crest (37.13 ft): 70-75%
-Chances of top Ten Historical Crest (34.65 ft): 95-98%
-Rough estimate of river crest with EP of 75%: 37 ft (rank: 6)
-Rough estimate of river crest with EP of 50%: 39 ft (rank: 3)
-Rough estimate of river crest with EP of 25%: 42 ft (rank: 1)

Now, the early February flood probabilities for the Mississippi River at Hastings:
-Chances of Moderate flooding: 95-97%
-Chances of Major flooding: 90%
-Chances of Historical Crest (25.90 ft): 12-15%
-Chances of top Five Historical Crest (21.30 ft): 50-55%
-Chances of top Ten Historical Crest (17.10 ft): 95%
-Rough estimate of river crest with EP of 75%: 19.2 ft (rank: 7)
-Rough estimate of river crest with EP of 50%: 22 ft (rank: 3t)
-Rough estimate of river crest with EP of 25%: 23 ft (rank: 3)

And the current probabilities at Hastings:
-Chances of Moderate flooding: >99%
-Chances of Major flooding: >99%
-Chances of Historical Crest (25.90 ft): 30-40%
-Chances of top Five Historical Crest (21.30 ft): 88-90%
-Chances of top Ten Historical Crest (17.10 ft): >99%
-Rough estimate of river crest with EP of 75%: 23 ft (rank: 3)
-Rough estimate of river crest with EP of 50%: 24.8 ft (rank: 2)
-Rough estimate of river crest with EP of 25%: 27 ft (rank: 1)

As you can see, the chances of significant flooding have increased for both the Red River and the Mississippi River. While the Red River and the Mississippi River are of great concern, they are not the only areas that will be affected by flooding this spring. As mentioned above, the James River, along with portions of the Big Sioux River in South Dakota, are currently above major flood stage. The Milk River in Montana, particularly around the town of Tampico, is also above major flood stage. Other areas of note that are under high risk include the Minnesota River and portions of southeastern New York, northern New Jersey, and northeastern Pennsylvania.

While these are the ‘high risk’ areas, the majority of the northern part of the country will have at least an above average chance for flooding (from NW Montana to Missouri to southern Maine, excluding the state of Michigan). The bottom line: the next month will be very active.

Posted in Flood, Minnesota, Mississippi River, North Dakota, Red River, South Dakota | Leave a comment

Decoding a TAF

Meteorologists at the National Weather Service (and elsewhere around the world) have duties in addition to forecasting and tracking weather for your local area. They also have to make a series specialized forecasts that particular industries rely on. The most important of these may be the Terminal Aerodrome Forecast, more commonly known as the TAF. The TAF relates to aviation, and is sent to local airports. Here is an example of a TAF:

TAF

KOKC 051130Z 051212 14008KT 5SM BR BKN030 TEMPO 1316 1 1/2SM BR

FM1600 16010KT P6SM SKC

BECMG 2224 20013G20KT 4SM SHRA OVC020 PROB40 0006 2SM TSRA OVC008CB

BECMG 0608 21015KT P6SM NSW SCT040 =

To someone who has no experience reading a TAF (or a METAR weather report, as they have a similar looking output), it can look incredibly complex. However, if you break it down into sections, it becomes much easier to understand. The first line indicates the type of report. There are two possibilities: a routine forecast (‘TAF’), and an amended forecast (‘TAF AMD’). Amended forecasts are used in the case that the forecast conditions don’t satisfactorily meet what is currently in the TAF. In this example, it is a routine forecast.

Moving to the second line, the line starts with a group of four letters: KOKC. These letters, which use the International Civil Aviation Organization codes, identify what station is being forecast for. In ICAO codes for the continental United States, the first letter is always a K, followed by a three-letter code to identify the location. In this case, KOKC is the Will Rogers Airport in Oklahoma City. For Alaska and Hawaii, the identifier starts with a P, then an A or H (depending on the state), and finish with a two-letter code to identify the location.

Immediately following the station identifier is when the forecast is being made. In this example, it is 051130Z. What this means is that the forecast was made on the 5th day of the month at 1130Z. In general, the format for this part is ddttttZ, where d=date and t=UTC time.

Next, 051212, is the time the forecast is valid for. TAF’s are issued to cover a 24 hour period, and are typically issued four times a day: 0Z, 6Z, 12Z, and 18Z. This TAF goes from 12Z on the 5th to 12Z on the 6th. One note is that there is a slight change for the 0Z TAF. For example, if this TAF had been issued starting at 0Z on the 5th, it would read 050024, ending at 24Z on the 5th, which is the equivalent of 0Z on the 6th.

What follows from this point forward is the actual forecast conditions. The TAF follows this format: Wind, Visibility, Weather, Sky Condition, Optional Data. The Wind grouping looks like this: dddssKT, where d is the wind direction, and s is the wind speed in knots. In this example, the wind is 14008KT, which indicates a wind of 8 knots coming from 140 degrees, or from the SE. Winds from the north are 0 or 360 degrees, from the east is 90 degrees, south is 180 degrees, and 270 degrees for winds from the west.

Visibility indicates the forecast visibility in statute miles. In this TAF (5SM), there is a forecast of five statute miles of visibility. Any forecast visibility over six statute miles is indicated as P6SM.

Next is the weather. There can be up to five parts in the weather grouping: a qualifier of intensity (+ for heavy,- for light, vc for in the vicinity, or nothing for moderate), a descriptor (TS = thunderstorm, SH = showers, etc.), precipitation (RA = rain, SN = snow, GR = hail), obscuration (FG = fog, BR = mist), and an other section (SS = sandstorm). A complete listing can be found here: http://aviationweather.gov/static/help/taf-decode.php#Weather. If it is a pleasant day, there may be no weather, and this section may be omitted. For this TAF, the weather is simple BR, which indicates mist.

Following the weather is the sky condition. The format of sky condition is ccchhh, where c is the cloud coverage and h is the height in hundreds of feet. At KOKC, the conditions are BKN030, which means a broken layer of clouds (mostly cloudy) at 3000 feet. Other possibilities for cloud coverage include OVC for overcast, SCT for scattered, FEW for few, and SKC for clear skies. In the event of wind shear, it would be listed after the sky condition. There is no wind shear at KOKC, so that is not in the TAF.

After the sky condition, you will notice something that says TEMPO 1316 1 1/2SM BR. What this means is that there will be a temporary change in conditions. For this TAF, there will be changes from 13Z to 16Z, and visibility will decrease to 1.5 statute miles, with mist still affecting the airport.

On the third line is the statement FM1600. This indicates a change in the prevailing conditions indicated on the previous line at 16Z. At this time, the winds shift to 160 degrees (SSE) at 10 knots, with visibility over 6 statute miles and clear skies.

On the fourth line is the statement BECMG. This is used when there is a gradual change in conditions. Following the BECMG is the starting and ending period (on line four, it starts at 22Z and ends at 24Z.) During this time, conditions are worsening. Winds are shifting to the SSW (200 degrees) at 13 knots, with gusts of 20 knots. Visibility is down to four statute miles. It is overcast at 2000 feet with rain showers.

At the end of the fourth line is this: PROB40 0006 2SM TSRA OVC008CB. The PROB40 indicates between a 30-50% probability of a weather event occurring; in this case, a thunderstorm between 00Z and 06Z. The CB at the end of the sky condition signifies a cumulonimbus cloud. PROB statements are not allowed during the first six hours of a TAF.

Lastly, in the fifth line, it says NSW. This indicates no significant weather, and is put in during time periods after significant weather has occurred. At the end of the line is an equal sign, which indicates the end of the TAF.

Putting that all together, and this is what the TAF is saying:

From 12-16Z, there will be mist, with visibility occasionally decreasing to 1.5 statute miles from 13-16Z.
At 16Z, there will be clear conditions.
Between 22-24Z, there will be a gradual change to showers, and between 00Z-06Z there will be a 40% chance of thunderstorms.
Between 06-08Z, the showers will disappear, and there will be partly cloudy skies.

Posted in Forecasting, TAF | 1 Comment

Severe Weather Across the Country

A cold front moving through the Ohio Valley into the Southeast has triggered a wave of severe weather the past couple of days. On Sunday, storm reports spanned from southern Ohio into Oklahoma (with an isolated hail report in Texas). The system moved to the east and today, to this point, has affected a region from southern Pennsylvania to Alabama, with additional high wind reports around St. Louis. In addition to the severe weather, heavy rainfall has led to widespread flooding across much of the region north of the Ohio River. While there have not been as many reports today as there was yesterday, many of the storms were still in progress at the time of this post.

February 27- The Great Plains and the Ohio Valley

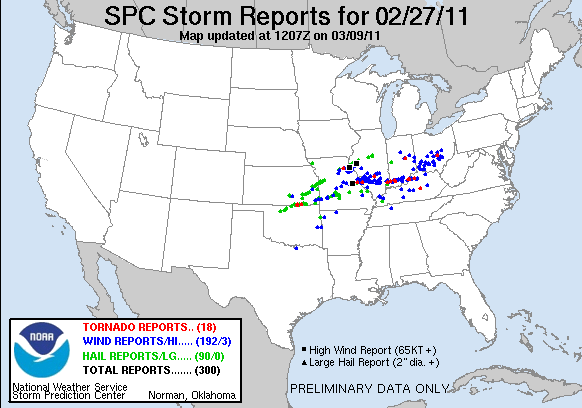
The cold front yesterday pushed through the Great Plains and the Ohio Valley, triggering 6 reported tornadoes and several reports of large hail and damaging winds. While the tornadoes have yet to be classified into the EF scale, from the little information given in the Local Storm Reports, none of the tornadoes appear to be very strong. Three of the tornadoes caused at least some damage: one tornado caused some damage to homes in St. Albans, MO; another in Shobonier, IL, damaged two homes, and a tornado just south of Millersport, OH, downed trees and damaged several buildings and silos. No injuries have been reported from any tornado.

Most of the hail reports were concentrated in Kansas and Missouri, while heavier wind reports tended to be further east, from eastern Missouri to Ohio. While the size of the hail in most reports were quarter sized, there were several reports of golf ball sized hail in Kansas, Missouri, and Illinois. The largest hail appeared to be in Buffalo, MO, where law enforcement reported baseball sized hail. As for the wind, while there were several reports of wind damage in Ohio and Indiana, the heaviest winds were found in Missouri and, to a lesser extent, Illinois. Near Hannibal, MO, there was a report of an 87 mph wind gust, while there was a report of 80 mph winds west of Lyon, MO. In Illinois, there were reports of 75 mph near Mount Sterling.

February 28- Southeast

Today, the severe weather continued eastward, spanning from Alabama into extreme southwestern Pennsylvania. At the time this was published, there had been five reports of tornadoes: three in southern Tennessee and one each in North Carolina and South Carolina. One tornado, south of Tullahoma, TN, has one reported fatality. In nearby Estill Springs, there was extensive damage to homes, along with downed trees.

One major difference between today’s outbreak and yesterday’s is that there has been much less severe-level hail today. There have been 24 reports of hail exceeding an inch today, while there were 62 such reports yesterday. The largest hail has been found in Alabama, with a couple reports of golf ball sized hail in and around Birmingham. While there have been slightly more reports of high winds today, the highest reported wind was 70 mph in Milton, WV, far short of the 87 mph found yesterday in Missouri.

There is still time for additional storm reports to come in. As of 830 PM, there is a line of storms stretching from North Carolina into southern Mississippi, appearing strongest from eastern Alabama to southern North Carolina. A section of eastern Alabama is under a tornado watch, while parts of Georgia, South Carolina, and southern North Carolina are under a severe thunderstorm watch. An isolated tornado is still possible, however, straight line winds appear to be the biggest threat for the duration of the storm tonight.

Posted in Alabama, Illinois, Kansas, Missouri, North Carolina, Ohio, Severe Weather, South Carolina, Tennessee, Tornado, West Virginia | Leave a comment

Snowfall in Minnesota

Over the weekend a low, moving westward across northern Iowa, dumped a large amount of snow across much of southern Minnesota. The town of Madison in western Minnesota (on the below map, is just WNW of Montevideo) reported 19 inches of snow, while Eden Prairie and my hometown of Bloomington, two suburbs SW of Minneapolis, each reported 17 inches. In conjunction with the snow in the SW portion of Minnesota, gusting winds of over 30 mph created blizzard conditions. The winds near the Twin Cities were not quite strong enough to prompt a blizzard warning, but the storm still triggered a Winter Storm Warning. Snowfall accumulated during the snow is as below:

February 20-21 Snowfall

This system is just the latest in an unusually snowy winter for the Twin Cities. It may be a winter that will go down in the record books. Through February 20th, there had been 72.9 inches of snowfall measured at the Minneapolis/St. Paul International Airport, with additional snowfall (last upping the season total to 73.6 inches at last measurement) falling earlier today. The 72.9 inches through the 20th makes this winter the 3rd snowiest on record through that day.

As seen above, the record through February 20th is 76.9 inches, set during the Winter of 1981-1982. One interesting note about this chart is that this winter has surpassed the snowfall accumulated during the Winter of 1983-1984 (72.9 vs. 69.3). The Winter of 83-84 is currently the snowiest winter on record, with 98.6 inches of total snowfall accumulated. The only other winter to surpass 90 inches is the Winter of 81-82, which accumulated 95 inches of snow. This winter is already the 11th snowiest on record, with just under two months of additional snowfall still to come.

This winter is coming off of a series of winters that had below average snowfall accumulation. Take a look at the graph below:

The graph is coded as followed: this winter (red), average winter (black), 1983-84 (yellow), 2009-10 (orange), 2008-09 (green), 2007-08 (purple), and 2006-07 (blue). While the average winter accumulates 55.9 inches of snow, the past four winters have all had roughly 40 inches of snow, close to 15 inches below normal. This winter is already nearly 20 inches above normal. For comparison’s sake, this winter surpassed 40 inches even before the calendar turned to 2011, whereas the average winter surpasses 40 inches around this time of the season. This winter has a very good chance of surpassing the combined total snowfall of the past two winters-not even a foot of additional snow is needed to accomplish this, and the average winter has roughly 15 accumulated inches of snow from this point onward. It should be noted that by this time last year, all of the accumulated snow had occurred.

While this winter is currently ahead of the pace that 83-84 set, it seems unlikely that it will become the snowiest winter on record. The Winter of 83-84, from this point on, still had two separate storms that dropped at least 10 inches of snow at the airport, with one of them occurring the last week of April. Typically, the last recorded snowfall in the Twin Cities occurs in early April. For this winter to surpass 83-84, there would need to be at least two significant snowstorms, with accumulations approaching 10 inches in each storm. Even if it does not become the snowiest winter on record, I would expect this to become the 3rd winter to surpass 90 inches of snowfall.

Posted in Blizzard, Minnesota, Snowfall, Winter | Leave a comment

The Great Louisiana Hurricane of 1812

When it comes to hurricanes, no city is in as vulnerable of a situation than the city of New Orleans. The below map demonstrates this:

Category 3-5 Hurricanes within 100 miles of New Orleans (1852-2005)

Obviously, the most recent Category 3+ storm to impact New Orleans was Hurricane Katrina in 2005, the costliest natural disaster in United States history. Other well chronicled storms have been Hurricane Betsy (1965) and the New Orleans Hurricane of 1915. One storm that not much was known about was the Great Louisiana Hurricane of 1812. However, Dr. Cary Mock, a geographer at the University of South Carolina, was able to use maritime records to reconstruct the hurricane- determining its intensity, as well as its track.

For obvious reasons, tracking hurricanes was much more difficult in the 1800’s than it has been the past 50 years. Even taking this into consideration, there were two additional factors that led to this storm being overlooked, both relating to the timing of the event. First of all, it was just a couple of years removed from the Louisiana Purchase. The Louisiana territory was still rather isolated, particularly from the press. In addition to this, the storm also made landfall during the War of 1812. What little information that was available was quickly forgotten about.

How was Dr. Mock able to recreate the storm? He retrieved information from two sources: local newspaper accounts, and more significantly, maritime records. The newspaper accounts covered the storm once it had made landfall, while the maritime records allowed Dr. Mock to chart the location and strength of the storm from all the way back to August 13th, when it was a tropical wave still to the south of Puerto Rico, all the way through landfall on August 19th. The information was retrieved from ship logs, which gave hour-by-hour reports of wind speed, direction, and barometric pressure, as well as ship protests- particularly from the schooner Rebecca- to create the path in the Gulf of Mexico.

The Great Louisiana Hurricane of 1812

So what was the impact of the storm? According to Dr. Mock, “The 1812 hurricane was the closest to the city, passing just to the west. It wasn’t as big as Katrina, but it was stronger at landfall, probably a mid-three or four category hurricane in terms of winds.” What was especially significant about the storm was the path it took. It made landfall from the east and moved WNW, with the eye coming within 5 kilometers of New Orleans. For geographical reasons, this is the worst case scenario for a landfalling hurricane in New Orleans.

“A hurricane like the one in August 1812 would rank among the worst Louisiana hurricanes in dollar damage if it occurred today,” said Mock. “Hurricane Betsey was 100 miles to the west. Katrina was to the east. A 1915 hurricane came from the South. By knowing the track and intensity, as well as storm surge, of the August 1812 hurricane, we have another worst-case-scenario benchmark for hurricanes. If a hurricane like it happened today — and it could happen — it would mean absolute devastation.”

If this storm occurred in current times, the damage would be even more catastrophic than it was in 1812 because the terrain is much more susceptible. In 1812, the sea level was lower, allowing the elevation of New Orleans to be higher. In addition, wetlands covered more of the area. For these reasons, the storm surge in 1812 was reduced by ‘several feet.’ Even with the hindered storm surge, the levee was destroyed, allowing the storm surge to inundate the southern portions of the city. At its peak, portions of New Orleans were under 15 feet of water.

If you are interested, here is more information on Dr. Mock’s study: http://www.sciencedaily.com/releases/2011/02/110205143630.htm

Posted in Great Louisiana Hurricane of 1812, Hurricane Katrina, New Orleans | Leave a comment